
Knowledge Base
Prometheus and grafana are helpful tools to monitor your nodes. They have a built-in alert function which notifies you about arising problems. This guide will show how to setup your infrastructure to do this monitoring with a separate machine thus not requiring additional installations on your vital cardano nodes.
Today we would like to show how to setup up prometheus and grafana to monitor your nodes via a comfortable grafana dashboard.
This guides sticks as closely as possible to the recommendations of the official cardano documentation and the official cardano stake pool school. We won't use any automated scripts (except using the precombiled cardano grafana dashboard of IOHK) since by doing this setup manually from scratch you develop a deeper understanding what exactly happens and thus enjoy a better learning experience.
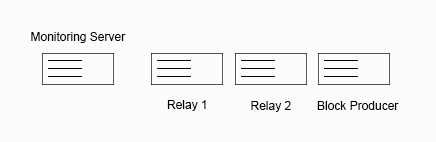
This guide assumes that your node infrastructure consists of at least 2 relay nodes, 1 block producer node and one machine dedicated for monitoring your nodes. This guide can be used as a basis for an infinite number of cardano nodes!
This guide also assumes that all your machines are running latest ubuntu versions.
If you have any questions please feel free to get in contact with us or join our official CardanoCafe telegram channel.
This section gives you an overview about what this guide will walk you through. We will walk through all the steps in detail below.
First of all, you do not need to install cardano-node to your monitoring server!
Your monitoring server requires only two leightweight installations:
The only application installed on your monitoring server which will communicate to your cardano nodes is prometheus. Prometheus will scrape the metrics of your cardano nodes in a predefined time intervall, e.g. 5 or 15 seconds.
In contrast, the only things which need to be done your cardano nodes are:
mainnet-config.json needs to simply get updated in one specific line. This is easily done with nano.We start our work at the cardano nodes. You have to do these steps on all your cardano nodes you wish to monitor.
On your cardano nodes, open mainnet-config.json with nano to edit.
nano mainnet-config.json
In that file, search for:
"hasPrometheus": [

   "127.0.0.1",

   12798

],
Replace the IP address 127.0.0.1 with 0.0.0.0 to allow listening for external connections.
"hasPrometheus": [

   "0.0.0.0,

   12798

],
Save the file and restart your nodes.
Next, we download and execute node_exporter. If not present, first, create a Downloads directory.
cd ~

mkdir Downloads

cd Downloads
Download and uncompress node_exporter. You can get the latest version of node_exporter here. In our example we're using node_exporter-1.0.1.
wget https://github.com/prometheus/node_exporter/releases/download/v1.0.1/node_exporter-1.0.1.linux-amd64.tar.gz

tar xvfz node_exporter-1.0.1.linux-amd64.tar.gz

rm node_exporter-1.0.1.linux-amd64.tar.gz

cd node_exporter-1.0.1.linux-amd64
Before we continue, you have to add two firewall rules to allow incoming connections.
sudo ufw allow proto tcp from IP.OF.MONITORING.SERVER to any port 9100

sudo ufw allow proto tcp from IP.OF.MONITORING.SERVER to any port 12798
Replace IP.OF.MONITORING.SERVER with the IP address of your monitoring server. Only the monitoring server should be allowed to scrape the metrics of your cardano nodes.
Finally, start node_exporter
./node_exporter
It is suggested to start node_exporter as a service or attached to background, tmux, etc...
At this step, you have completed preparing your nodes.
Now, let's login to your monitoring server.
First, install prometheus. You can get the latest version of prometheus here. In our example we're using prometheus-2.22.2.
If not present, create Downloads directory.
cd ~

mkdir Downloads

cd Downloads

wget https://github.com/prometheus/prometheus/releases/download/v2.22.2/prometheus-2.22.2.linux-amd64.tar.gz

tar xvfz prometheus-2.22.2.linux-amd64.tar.gz

rm prometheus-2.22.2.linux-amd64.tar.gz

cd prometheus-2.22.2.linux-amd64/
Next, change the prometheus config and enter the IP addresses of your cardano-nodes to query.
nano prometheus.yml
We stick as closely as possible to official cardano documentation. Edit your file to look like this:
# my global config

global:

  scrape_interval:     15s # Set the scrape interval to every 15 seconds. Default is every 1 minute.

  evaluation_interval: 15s # Evaluate rules every 15 seconds. The default is every 1 minute.

  external_labels:

        monitor: 'codelab-monitor'

  # scrape_timeout is set to the global default (10s).


# Alertmanager configuration

alerting:

  alertmanagers:

  - static_configs:

    - targets:

      # - alertmanager:9093


# Load rules once and periodically evaluate them according to the global 'evaluation_interval'.

rule_files:

  # - "first_rules.yml"

  # - "second_rules.yml"


# A scrape configuration containing exactly one endpoint to scrape:

# Here it's Prometheus itself.

# The job name is added as a label `job=` to any timeseries scraped from this config.


scrape_configs:

  - job_name: 'cardano_relay1' # To scrape data from the cardano node

    scrape_interval: 5s

    static_configs:

      - targets: ['IP.OF.YOUR.RELAY1:12798']

  - job_name: 'node_relay1' # To scrape data from a node exporter to monitor your linux host metrics.

    scrape_interval: 5s

    static_configs:

      - targets: ['IP.OF.YOUR.RELAY1:9100']


  - job_name: 'cardano_relay2' # To scrape data from the cardano node

    scrape_interval: 5s

    static_configs:

      - targets: ['IP.OF.YOUR.RELAY2:12798']

  - job_name: 'node_relay2' # To scrape data from a node exporter to monitor your linux host metrics.

    scrape_interval: 5s

    static_configs:

      - targets: ['IP.OF.YOUR.RELAY2:9100']


  - job_name: 'cardano_block' # To scrape data from the cardano node

    scrape_interval: 5s

    static_configs:

      - targets: ['IP.OF.YOUR.BLOCKPRODUCER:12798']

  - job_name: 'node_relay2' # To scrape data from a node exporter to monitor your linux host metrics.

    scrape_interval: 5s

    static_configs:

      - targets: ['IP.OF.YOUR.BLOCKPRODUCER:9100']
Replace IP.OF.YOUR.RELAY1, IP.OF.YOUR.RELAY2, IP.OF.YOUR.BLOCKPRODUCER by the corresponding IP addresses.
Thereafter, still on your monitoring server, you need to open two ports so that you can access the statistics in your browser and from any device you want.
sudo ufw allow proto tcp from any to any port 3000

sudo ufw allow proto tcp from any to any port 9090
To sum it up:
Of course you may restrict the access to these metrics to specific IP addresses of your client computers/notebooks when you do not want that everyone can view your metrics.
Thereafter, start prometheus. It is recommended to start this in background, attached to tmux, or in any other way so that this doesn't block your command line.
./prometheus --config.file=prometheus.yml
At this step, you should check if prometheus is working and receiving data from your cardano nodes.
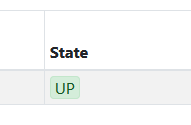
In your client browser, open IP.FROM.MONITORING.SERVER:9090. You should see the landing page of prometheus. Click on Status -> Targets to view your nodes.
The state of all your node jobs should be "up"
When prometheus is working, you can continue with the next step: download and install grafana and start it.
cd ~/Downloads

wget https://dl.grafana.com/oss/release/grafana-7.3.2.linux-amd64.tar.gz

tar -zxvf grafana-7.3.2.linux-amd64.tar.gz

rm grafana-7.3.2.linux-amd64.tar.gz

cd grafana-7.3.2

cd bin

./grafana-server
Please note: It is encouraged to start grafana-server attached to background, with tmux or anything comparable so that it does not block your command line.
On your client machine open IP.OF.MONITORING.SERVER:3000 with a browser of your choice to access grafana. Login with the default login admin and password admin. Thereafter your're prompted to change your password.
In the next step you need to add prometheus as data source. Click on:
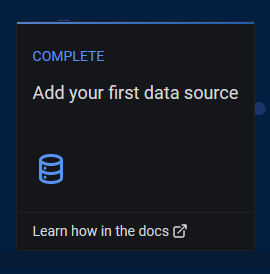
In the next screen click on prometheus.
In the next step, fill out the form as below. Please be careful: prometheus must be written lowercase! Otherwise your dashboard won't work!
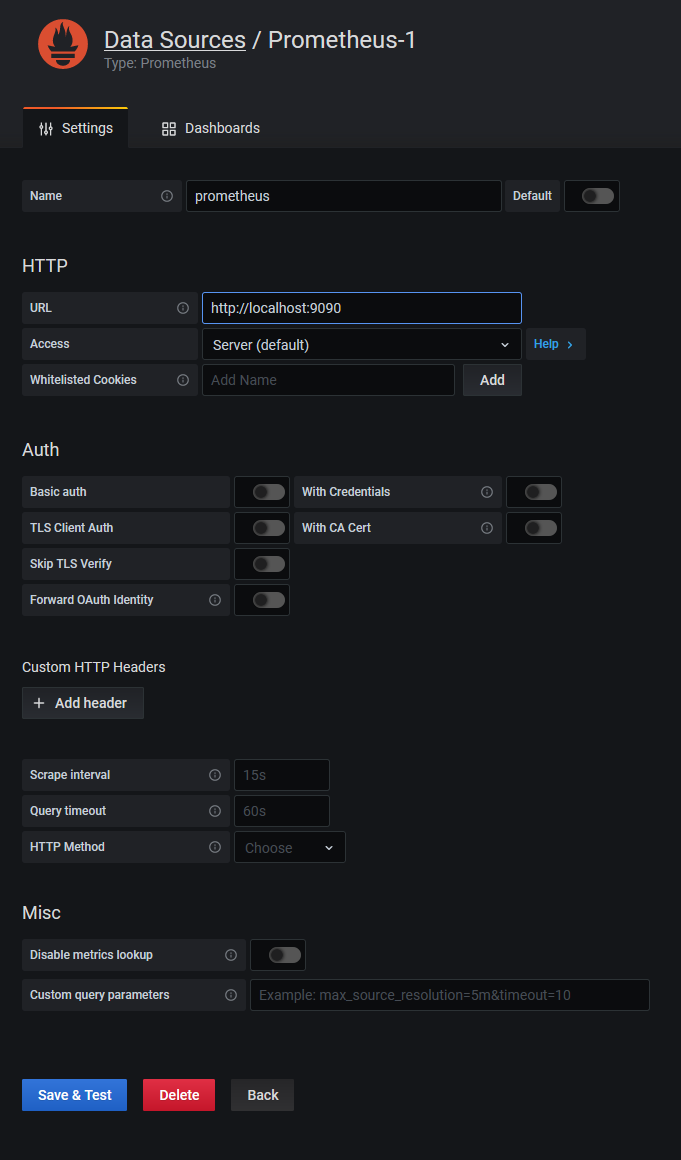
Click Save & Test
In the next step, we need to import the precombiled dashboard of IOHK.
Copy cardano-application-dashboard-v2.json from the cardano-ops repository to your clipboard.
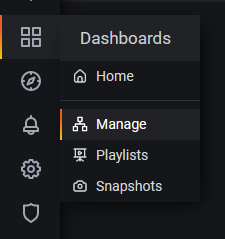
In grafana, in the left menu, click on Dashboards -> Manage.
In the next page, at the top right corner, click on Import and paste your clipboard to the textarea appearing in the next screen..
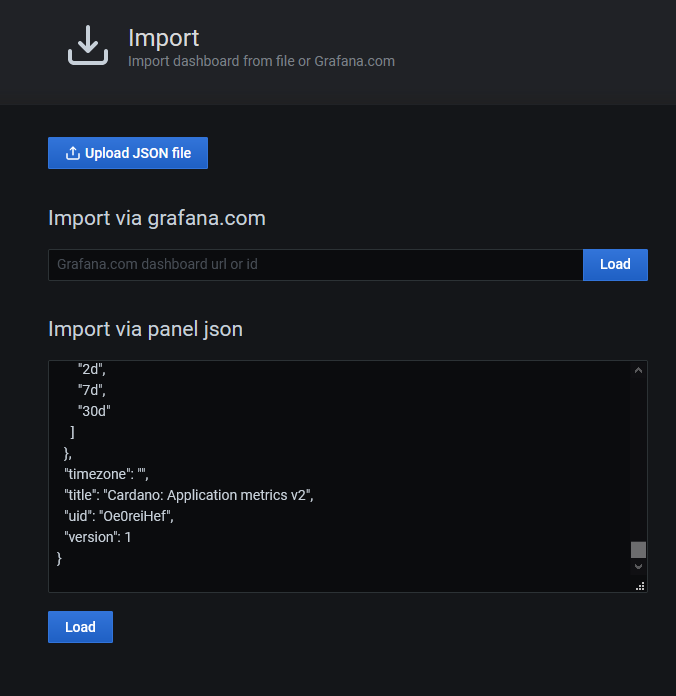
Click on Load.
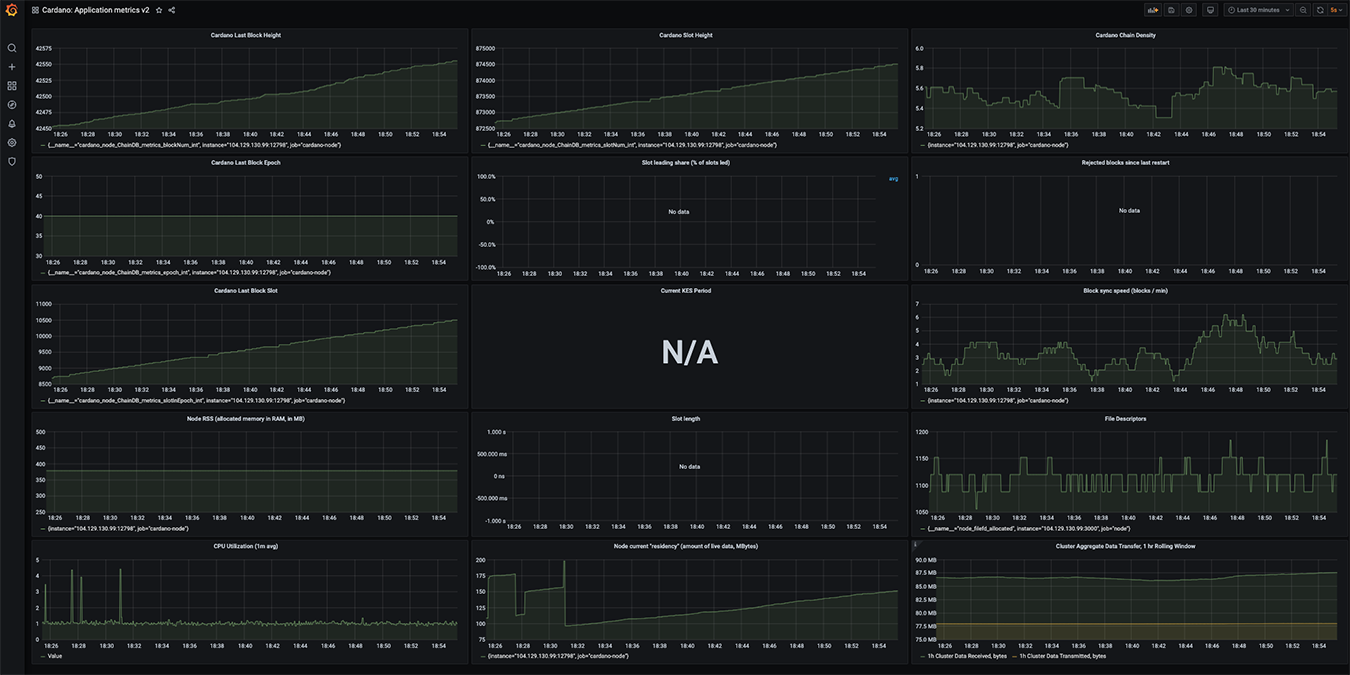
Go back to your welcome screen of Grafana. You should now be able to open your metrics by clicking Cardano: Application metrics v2.
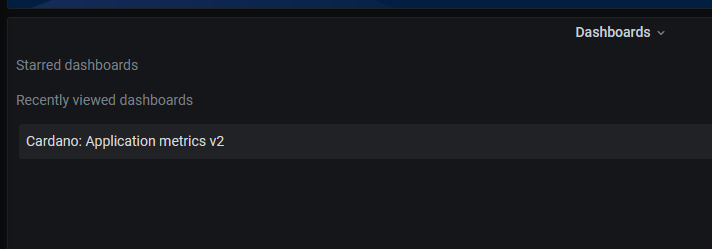
Enjoy your metrics. That's it!
I hope this guide helped you in setting up grana and prometheus. If you have any questions feel free to visit us in Telegram. We're happy to help.

|
written by: Chris published at: Nov 21, 2020 |

Knowledge Base
Dec 3, 2023, by Eric Hill

Knowledge Base
Sep 7, 2023, by Eric Hill

Knowledge Base
Apr 9, 2023, by Eric Hill

Knowledge Base
Mar 22, 2023, by Eric Hill

Knowledge Base
Oct 22, 2022, by Eric Hill